Opinion: The bulls are fighting off challengers for control of the stock market

The U.S. stock market, as measured by the S&P 500 index
SPX,
continues in its blissfully strong bullish trend. Once again, the S&P 500, the NASDAQ-100 Index
QQQ
and the Dow Jones Industrial Average
DJIA
are all hitting record highs, though many stocks are lagging behind. The Russell 2000
IWM,
for example, is far below its all-time highs. But if you own the S&P 500 or index-tied options, then the chart is bullish, and a core bullish position is still warranted. Some warning signs are beginning to appear (worsening market breadth, for example), but they have not generated confirmed sell signals yet, for the most part.
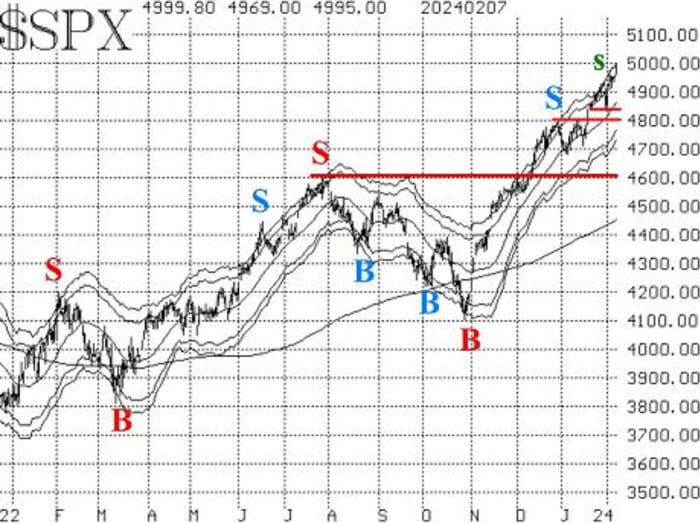
The S&P 500 chart has support at 4,850 (last week’s lows) and stronger support at 4,800. There is major support at 4,600, although a pullback to that level would be some cause for concern, merely because it is more than 300 points lower than current levels.
There is no traditional resistance, since the S&P 500 is trading at all-time highs. In fact, the index almost touched its +4σ “modified Bollinger Band” again yesterday. A close above that band would stop out the “classic” mBB sell signal (small green “s” on the accompanying SPX chart). We don’t trade those “classic” signals, preferring to wait for a more complete setup of the McMillan Volatility Band sell signal, which has not occurred. If the S&P 500 closes above that +4σ Band, that would reset the whole process and the generation of a new sell signal would have to begin again.
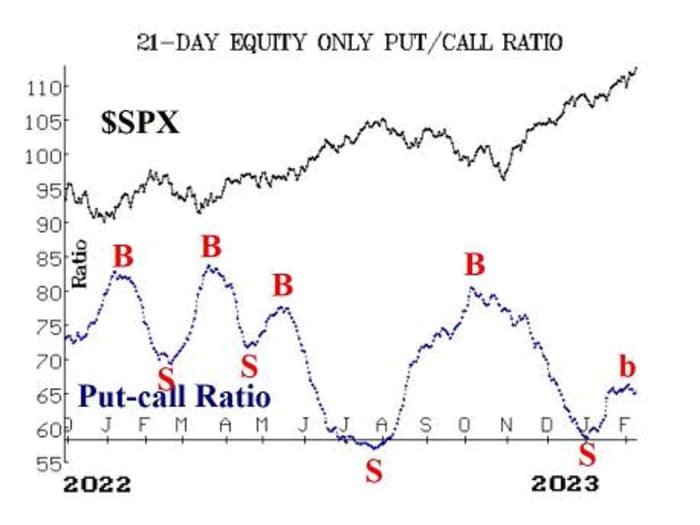
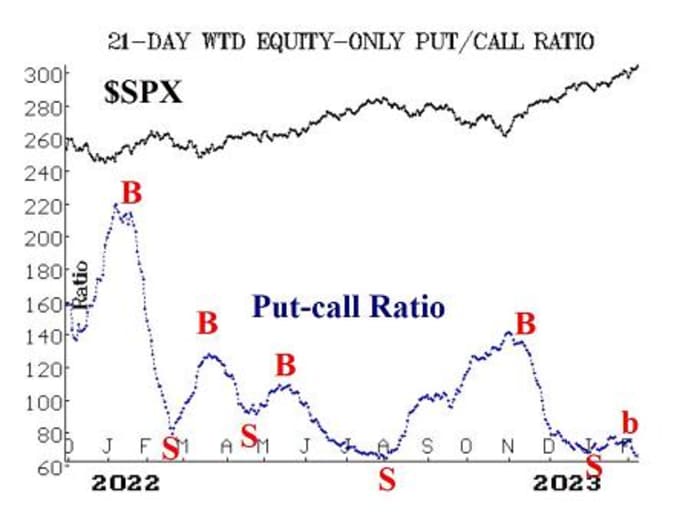
Equity-only put-call ratios have generally moved sideways over the past few weeks and now have turned downward again. They are very near the lower edges of their charts — i.e., in overbought territory. That is not the ideal place for a buy signal to take place, but as long as they are trending lower, that’s generally a bullish sign for stocks. The latest downturn is marked with a small “b” on the accompanying charts, merely because it’s coming from such a low level on the chart. These ratios will only be bearish if they begin to trend higher, and that has just not been the case.
Market breadth has been poor, and the breadth oscillators are on sell signals. This has been the case even with the S&P 500 at new all-time highs. A related indicator, Cumulative Volume Breadth, is also showing a negative divergence.
New highs on the New York Stock Exchange have continued to outnumber new lows, except for one day, so this indicator remains positive. This buy signal would be stopped out if, on the NYSE, new lows exceeded new highs for two consecutive days.
Volatility
VIX
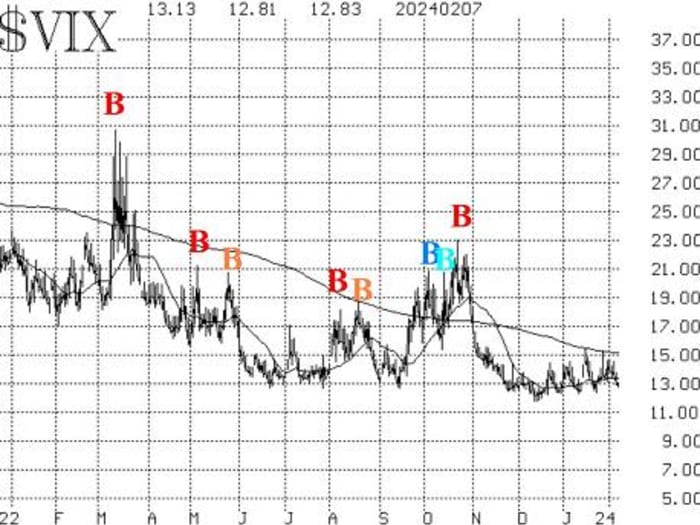
has remained at low levels, and as long as that is the case, it does not present a problem for the stock market. The trend of VIX buy signal remains in place. The 200-day moving average of VIX is at 15.20, and a close above there would be the first sign of trouble. So far, that hasn’t happened.
The construct of volatility derivatives continues to paint a bullish picture for the stock market as well. The term structures of the VIX futures and of the CBOE Volatility Indices
VX00,
continue to slope upward, and that is bullish for stocks.
We continue to maintain a core bullish position, and we will trade other confirmed signals around that core. Moreover, we are rolling calls up to higher strikes when they become fairly deeply in-the-money.
Market insight: Important divergence
There is a developing divergence between cumulative volume breadth and the S&P 500. That is, the index is making new all-time highs, but CVB is not. CVB is merely the running daily total of “advancing volume minus declining volume.” There are two uses for CVB: one is when CVB makes a new all-time high before the S&P 500 does. Then the index normally follows. We traded this positive signal last fall.
However, there is a negative signal as well. When the S&P 500 is making new all-time highs and CVB is lagging behind, that is a warning sign for the stock market. However, this negative divergence can last for a long time — it is not an immediate sell signal. There is a negative divergence at the current time, as the accompanying chart shows.
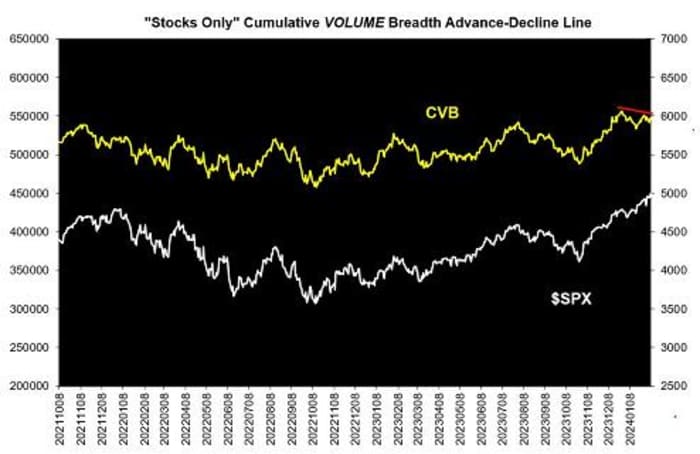
On the right-hand side, we can see that CVB last made a new all-time high in late December, and it has since fallen back while the S&P 500 has gone on to a series of new all-time highs.
The way we usually interpret this is: Do not ignore any sell signals while this divergence is in place. For example, in the market commentary above, we noted that there is now a breadth oscillator sell signal. Ordinarily we would be somewhat wary of the breadth oscillator signals because they have experienced a number of whipsaws in the past. However, given the fact that there is a negative divergence with CVB, we are going to act on that breadth oscillator sell signal.
Buy 1 SPY Mar (1st) at-the-money put: We will stop out of this trade if the breadth oscillators gain strength and move back to an overbought condition.
New recommendation: Potential MVB sell signal: This recommendation is repeated from last week. It appears highly unlikely that it will be confirmed, but we will keep it open, just in case. A “classic” modified Bollinger Band sell signal has occurred. We don’t trade those, but we will trade a McMillan Volatility Band sell signal if that is confirmed. Specifically, that would be confirmed if the S&P 500 were to trade at 4,824 or lower. That price is fixed, so it remains there in the following days as well as today.
IF SPX trades at 4,824 or lower, then buy 1 SPY
SPY
March 15 at-the-money put and Sell 1 SPY March 15 put with a striking price 25 points lower.
If this trade is established, it would have a target of the lower -4σ Band, and it would be stopped out if the S&P 500 were to close above the +4σ Band.
New recommendation: Potential VIX sell signal
This is also a repeat recommendation from last week. If VIX closes above its 200-day moving average, that would be a negative signal that would likely be accompanied by other indicators as well.
IF VIX closes above 15.30, then buy 1 SPY March 15 at-the-money put and sell 1 SPY March 15 put with a striking price 25 points lower.
If this trade is established, we will set a stop for it next week.
Follow-up action
All stops are mental closing stops unless otherwise noted.
We are using a standard rolling procedure for our SPY spreads: In any vertical bull or bear spread, if the underlying hits the short strike, then roll the entire spread. That would be roll up in the case of a call bull spread or roll down in the case of a bear put spread. Stay in the same expiration and keep the distance between the strikes the same unless otherwise instructed.
Long 4 XLP
XLP
Feb. 16 72 calls: Raise the stop to 72.60.
Long 1 SPY Feb. 16 493 call: This position was initially a long straddle. It was rolled up, and the puts were sold. The calls were rolled up several more times, including most recently on Feb. 2, when SPY traded at 493. This is, in essence, our core bullish position. Roll the calls up every time they become at least eight points in-the-money.
Long 0 UNM March 15 45 calls: These calls were stopped out on Feb. 1, when Unum
UNM,
closed below 47.80.
Long 1 SPY Feb. 16 492 call: This was originally a long straddle. The call was rolled up, most recently on Feb. 2, and the put was sold. Roll up every time the call is eight points in-the-money. Meanwhile, raise the closing stop to 486.
Long 3 TLT
TLT
May 19 95 puts: We will hold as long as the put-call ratio sell signal is in place for T-Bonds.
Long 1 SPY Feb. 16 494 call: This call was bought in line with the new highs vs. new lows buy signal. Stop out if NYSE new lows exceed new highs for two consecutive days. The call was rolled up on Feb. 2. Roll up every time the call is eight points in-the-money.
Send questions to: lmcmillan@optionstrategist.com.
Lawrence G. McMillan is president of McMillan Analysis, a registered investment and commodity trading adviser. McMillan may hold positions in securities recommended in this report, both personally and in client accounts. He is an experienced trader and money manager and is the author of the best-selling book “Options as a Strategic Investment.” www.optionstrategist.com
©McMillan Analysis Corporation is registered with the SEC as an investment adviser and with the CFTC as a commodity trading adviser. The information in this newsletter has been carefully compiled from sources believed to be reliable, but accuracy and completeness are not guaranteed. The officers or directors of McMillan Analysis Corporation, or accounts managed by such persons, may have positions in the securities recommended in the advisory.